|
Hybrid design solutions
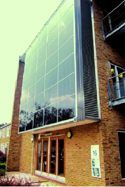
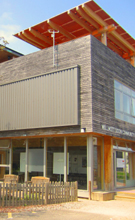
BIPV double façades
|
 |
|
|
|
| An actual case study breakdown by energy use |
|
BBC's broadcasting house was used in CIBSE's presentation of Guidance TM54. The published graphs (CIBSE Sep. 2013 journal) offer us an indicative breakdown regarding today's commercial buildings energy consumption via estimates and actual 5 year measured data. Breakdown percentages represent ratio of energy of a particular use compared to the total energy consumed disregarding unregulated energy (ie lifts, servers, office equipment).
| Energy Consumption Breakdown (%) |
|
Part L |
TM54 |
Actual data |
| Lighting: |
37 |
26 |
25 |
| Fans, Pumps & Controls: |
38 |
32 |
38 |
| Cooling: |
8 |
20 |
27 |
| Hot water (gas): |
8 |
5 |
4.5 |
| Heating (gas): |
21 |
10 |
9 |
Unregulated energy uses ratios(not included in Part L) compared to initial total:
| Energy Consumption Breakdown (%) |
|
Part L |
TM54 |
Actual data |
| Lifts: |
- |
2.5 |
2.3 |
| Servers: |
- |
20 |
18 |
| Office equipment: |
- |
15 |
14 |
TM54 seems to be doing a much better job in estimating lighting, heating, DHW and has moved quite closer to the actual cooling ratio. However CIBSE's presentation shows that fans, pumps & controls (not specifying if these relate to heating, cooling, DHW or ventilation) are not as accurately represented by TM54. Additional uses of this methodology seem to agree very closely with measured data.
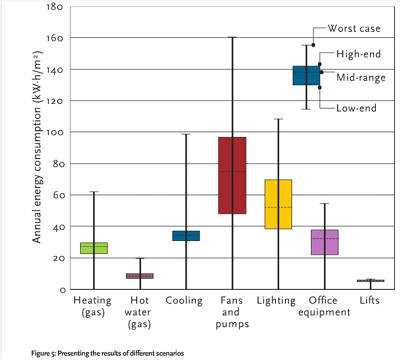
Regarding actual energy consumption figures TM54 calculation results, sensitivity analysis and range of scenarios applied offer us the following calculation outcomes/deviations:
| Annual Energy Consumption Breakdown (kWh /m2) |
|
Mid-range |
High & Low-ends |
| Heating (gas): |
27 |
30-21 |
| Hot water (gas): |
8 |
9-7 |
| Cooling: |
33 |
38-30 |
| Fans & Pumps: |
75 |
97-47 |
| Ligthing: |
53 |
62-38 |
| Office equipment: |
32 |
38-22 |
| Lifts: |
5 |
5.5-4.5 |
| |
|
| |
|
|
|
|
|
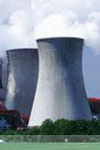
Is nuclear viable? |